Yesterday afternoon the HHS/DOGE team dropped that massive 11GB Medicaid provider spending file (2018–2024 claims aggregates), and we couldn’t resist loading it into our dashboard. Since remote care is what we do at FairPath, I focused on those codes. In particular, I analyzed Remote Physiological Monitoring (RPM).
Important note: I am not accusing anyone of fraud. Our software simply takes signals already defined by the Office of Inspector General, plus some practical checks from experience, to assign a warning count and score to each practice based on the public data. These are just patterns worth reviewing.
With the disclaimer out of the way, let’s get into the insights.
Already running RPM, CCM, RTM or APCM? Want to see if your practice is on the list?
Methodology: how we analyzed the data
We looked at the public HHS Medicaid billing aggregates for remote care codes, searching for practical signals of unusual patterns. Things like sudden jumps or drops in patient volume month-to-month, imbalances between setup/supply and ongoing management codes, or lower-than-expected utilization. These are inspired by common oversight guidelines from the OIG.
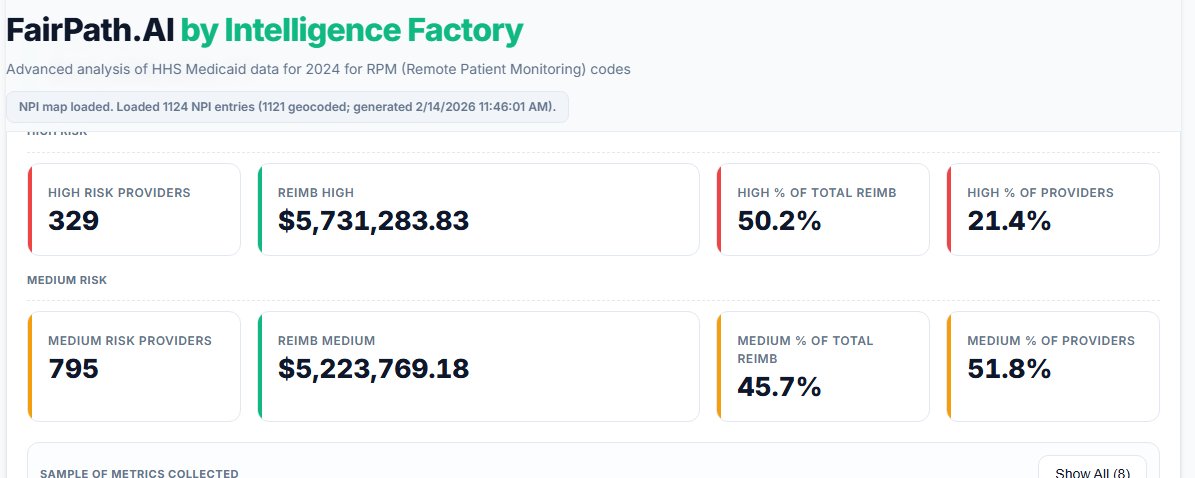
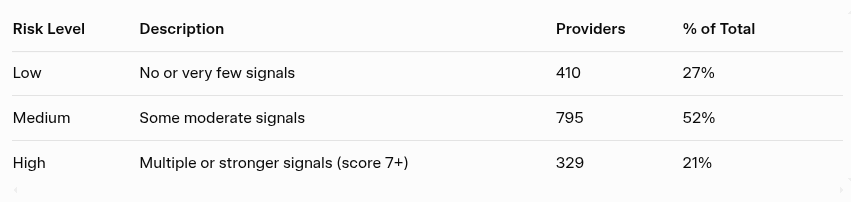
We score each provider based on how many and how strongly these signals appear (out of a maximum 15), while also counting individual warnings. Providers are then grouped into three risk tiers based on warning count and composite score.
Everything in this article is anonymized, and the focus is on highlighting trends for review.
Geographic hotspots
First, the geography is wild. Almost all the anomalous patterns cluster in three spots: New York metro, greater Los Angeles, and a bit around Phoenix. These are the biggest Medicaid markets and telehealth hubs.
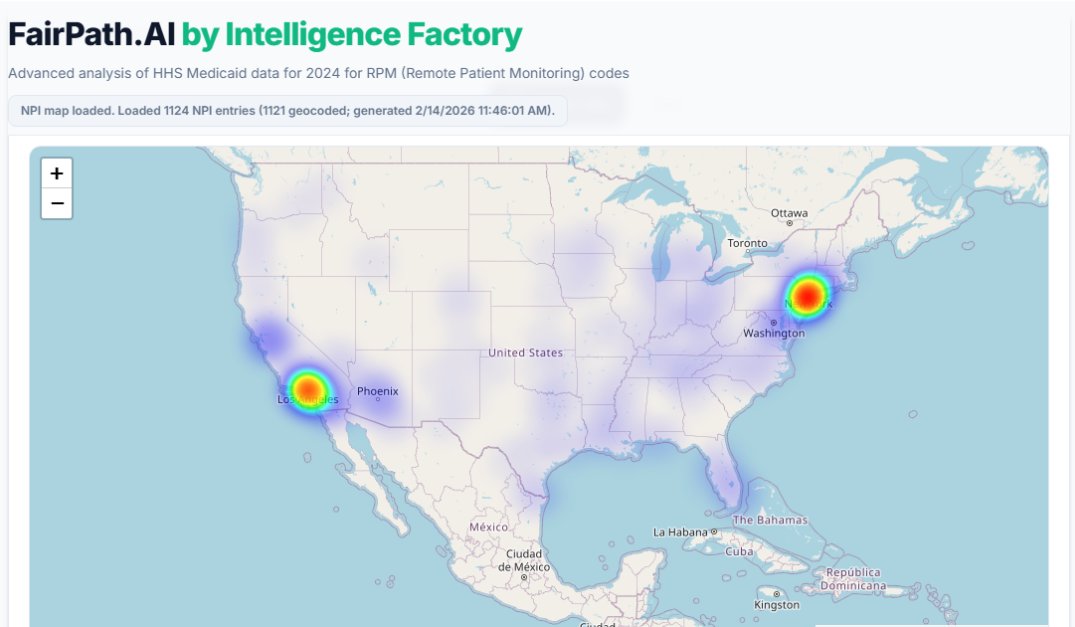
What I found interesting is the lack of Texas and Florida, considering their large populations.
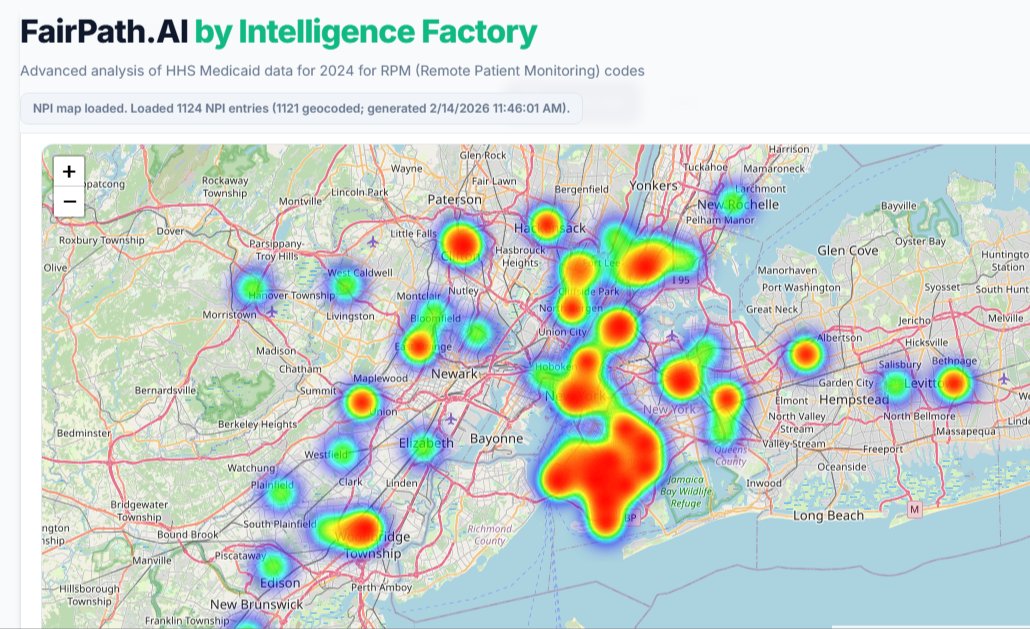
Zooming in on New York shows interesting density in Brooklyn. Some of the largest-volume providers (including those with strong signals) are there.
Reimbursements
Overall, Remote Physiological Monitoring is still a small program in Medicaid—a drop in the bucket compared to billions spent elsewhere. Total across these codes in 2024 was around $11.4M.
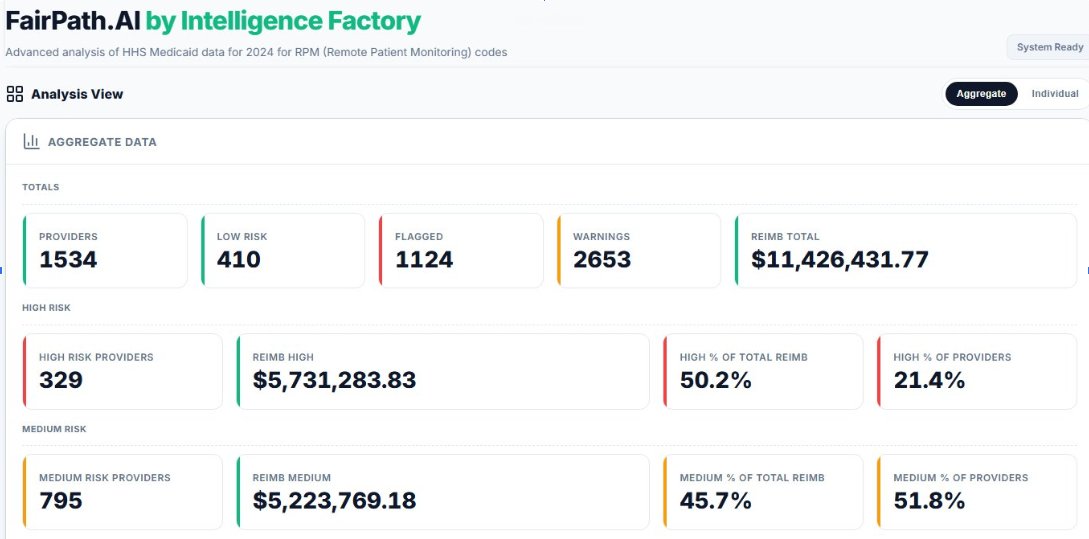
Out of 1,534 providers billing remote care codes, 73% triggered at least one flag. But the real eye-opener: the 329 highest-risk providers (multiple warnings + composite score 7+) captured more than 50% of the entire reimbursement.
That’s a classic Pareto situation: 21% of providers driving half the dollars, and they’re the ones with the spikiest patterns.
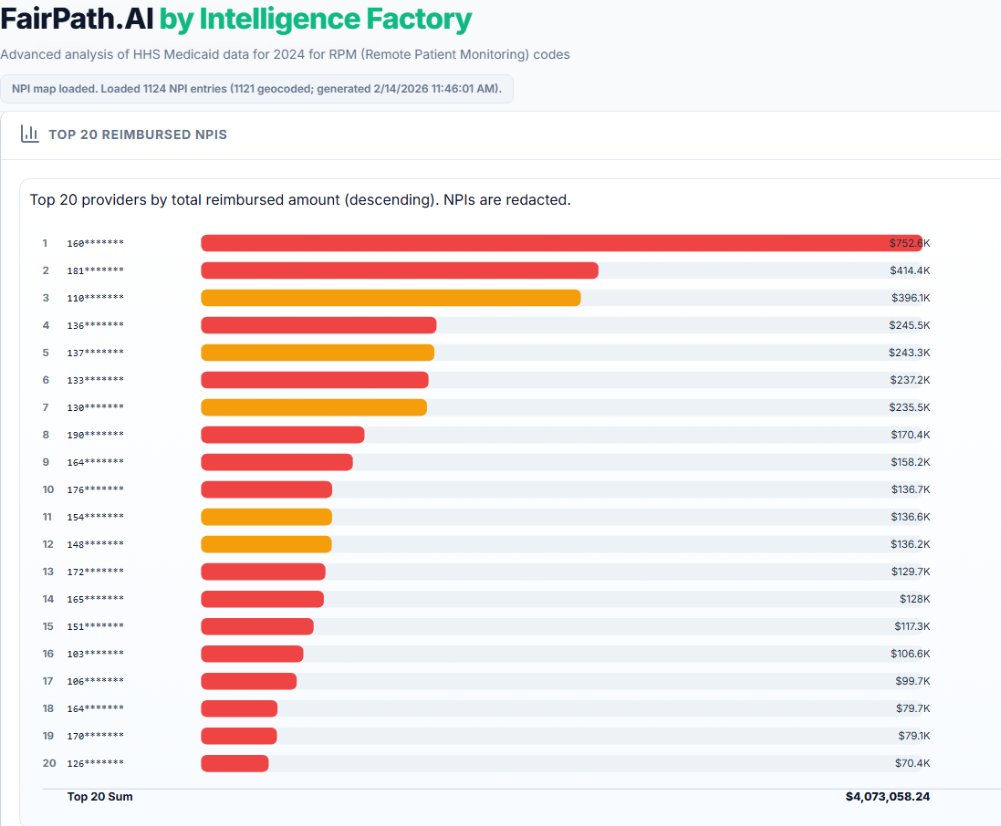
Zooming in on the money: the top 20 providers alone grabbed about 35% of total RPM spend. The #1 outlier pulled in 10x what #20 did. Red bars = 3+ warnings, yellow = 1–2. You can see the concentration visually. Those top few bars are massive.
Spiking patterns
A lot of these high-dollar cases show the same signature: sudden onboarding velocity (thousands of beneficiaries in a single month), inconsistent code ratios (way more device supply than management time), and rapid drop-off afterward. Operationally tough to explain without big infrastructure or panel reassignments.
Here’s a particularly interesting example:
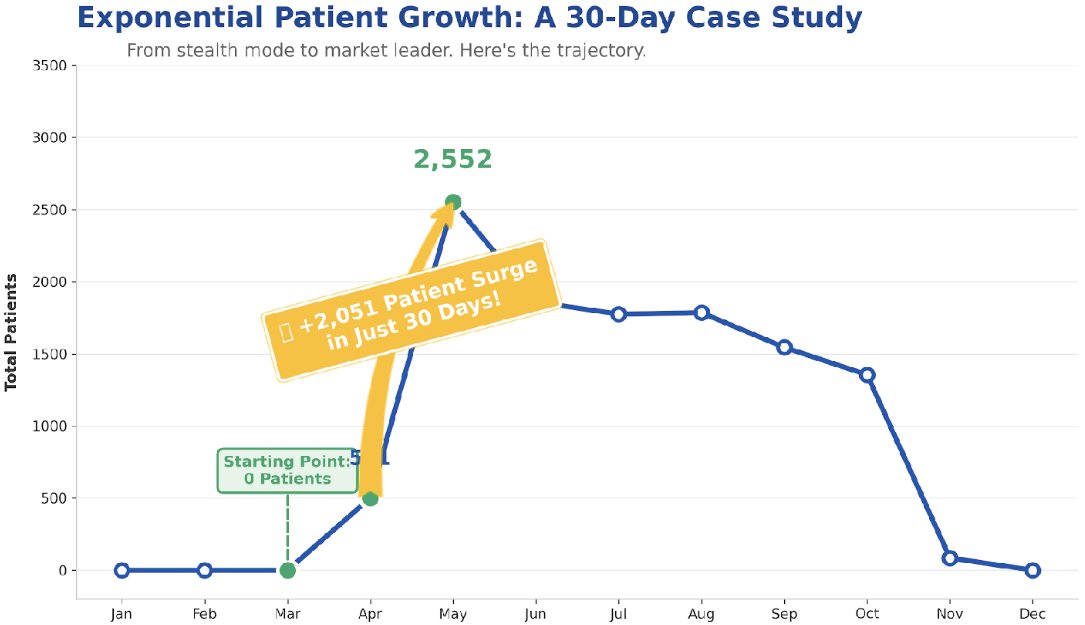
This single provider onboarded roughly 2,500 patients across two months (over 2,000 in one month alone). That’s impressive, and… operationally challenging. Could it be they took on a cohort from someone else?
One key compliance note: CMS requires an established patient relationship for RPM billing post-PHE. Sudden bulk transfers without documented priors can raise questions, especially when combined with low ongoing engagement.
It’s also interesting that nearly all the patients left the program within the year. This suggests they may have been transferred again. Unfortunately, this dataset doesn’t give patient-level details, so we can’t know for sure.
Conclusion
This is the first time Medicaid has released provider-level data at this scale, and it’s fascinating to see how real providers are using RPM with lower-income populations (compared to Medicare’s older demographic focus). We’ll publish more analysis in the coming weeks.
If you’re running RPM/CCM/RTM in Medicaid (or Medicare), or just curious about your own patterns, hit me up.
Thanks for reading! More coming as we dig deeper.